02 Oct Analyzing your trades
Analyzing your trades
This is going to be a continuous series as part of my trading journal. A never-ending saga on my winners and losers in the market. I know everyone on the internet says you should keep a trading journal, bla bla bla. Analyze your trades, bla bla bla. Well… They might be onto something here. There is something in those BLA’s. Let’s go find them.
DISCLAIMER
Part of a series
This is part of a series that I am writing to finish my trading plan. Here you can find other articles on how I am writing my trading plan. Hope this helps you in some way with your trading.
Treating trading like a business.
Here it goes…
Every broker allows you to ‘print’ out a performance report of some kind. Mine is called an account statement. It basically shows all the trades you made. When you opened and closed them. What was the duration and how much profit or loss did you make on each trade? By analyzing these trades we can gain a bit of insight and possibly draw some conclusions that help our trading. I understand this is only a month of ‘historical data’. The idea is to do this every month. Without further ado. I present to you, the Bla Bla.
The Bla Bla
My account statement from the period of August 27th till September 28th shows me the following information:
- A summary of my account
- Balance, equity, P/L, etc.
- Working orders
- Orders that haven’t been filled yet.
- Open positions
- Current positions that haven’t been closed yet (ie. open) come on! I really had to explain this one?!
- Balance chart
- This shows you the summary of your trades and is the most important part that I will discuss more in detail in a bit.
- And balance details
- Basically the raw data for the conclusions on the Balance chart.
Balancing numbers
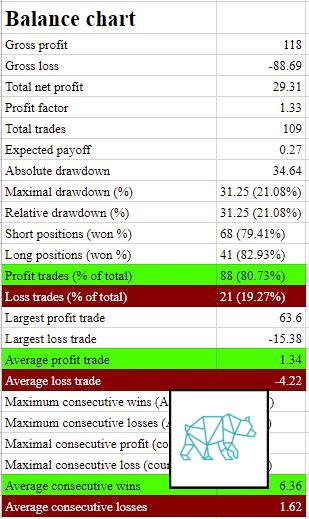
First off, my balance chart somehow shows my profits always include the money I had in my account. Which is weird to me. So my total net profit is actually not my profits (not the way I see it) but my account size at that time. However, I think that it doesn’t matter because it’s more about the statistics. These have value because we can draw conclusions and make assumptions on. So keep that in mind. This is how my balance chart looks like after I put it in Google Sheets (the hell with Excel!):

As you can see I have already highlighted some points that I thought were interesting from the get go. At a glance we can see that from the 109 trades I made 88 (80.73%) trades that turned a profit and 21 (19.27%) that didn’t. My average profit was 1.34 Euros. I know, right?! KACHING! And ‑4.22 Euros for the losing trades. I believe it’s about the percentages. If I had traded a bigger account with bigger positions I would have made that much more. Although, bigger positions definitely put a bigger emotional load on you so I’d be lying to say that it wouldn’t matter in your trading. But that’s a story for another time, kids. Back to the balance chart.
In the balance chart we can also see ‘cute’ things like maximum consecutive wins and losses etc. We can also see the averages of them. However the most important part for me is that in this month I got more right than wrong. However, I still lost money overall. This was due to the fact that I didn’t cut my losses short when I should have.
Let’s draw some conclusions

From this chart we can draw a few conclusions:
- The most trades I closed in 10 ‑20 minutes. Overall I keep my trades open (regardless of win/lose) under one hour.
- Most trades I make on the Wednesdays but generally more on the first 4 days of the week and the least on Fridays.
- Based on this data I am more of a scalper/daytrader.
I know I can analyze this more by asking more questions about the data but since I only have one month worth of data I don’t want to spend too much time on this. I already have some important conclusions drawn that can help me with my trading ‘game’. ALl this information I will incorporate into my trading plan.
So kids?! What have we learned today?
I am more a scalper than daytrader. I definitely like to get in and out very frequently. I think this is because I think I can see when prices will return in the opposite direction even for a little while. I will read more books and online resources on scalping to learn how others are doing it. But like always, I will probably just disregard what they say and do my own thing to find out either the authors were right or wrong. This might sound counterintiuitive to most people but I truly believe to fully understand something you have to figure things out in your own way. I don’t believe you should follow anyone. Don’t follow me neither. I am just showing my path and hopefully that helps you in some way.
Thank you
As always, thank you for reading and being part of my journey. Let me know how yours is going. And don’t forget to troll me if you like. I dare you. Good luck on your trading.


No Comments