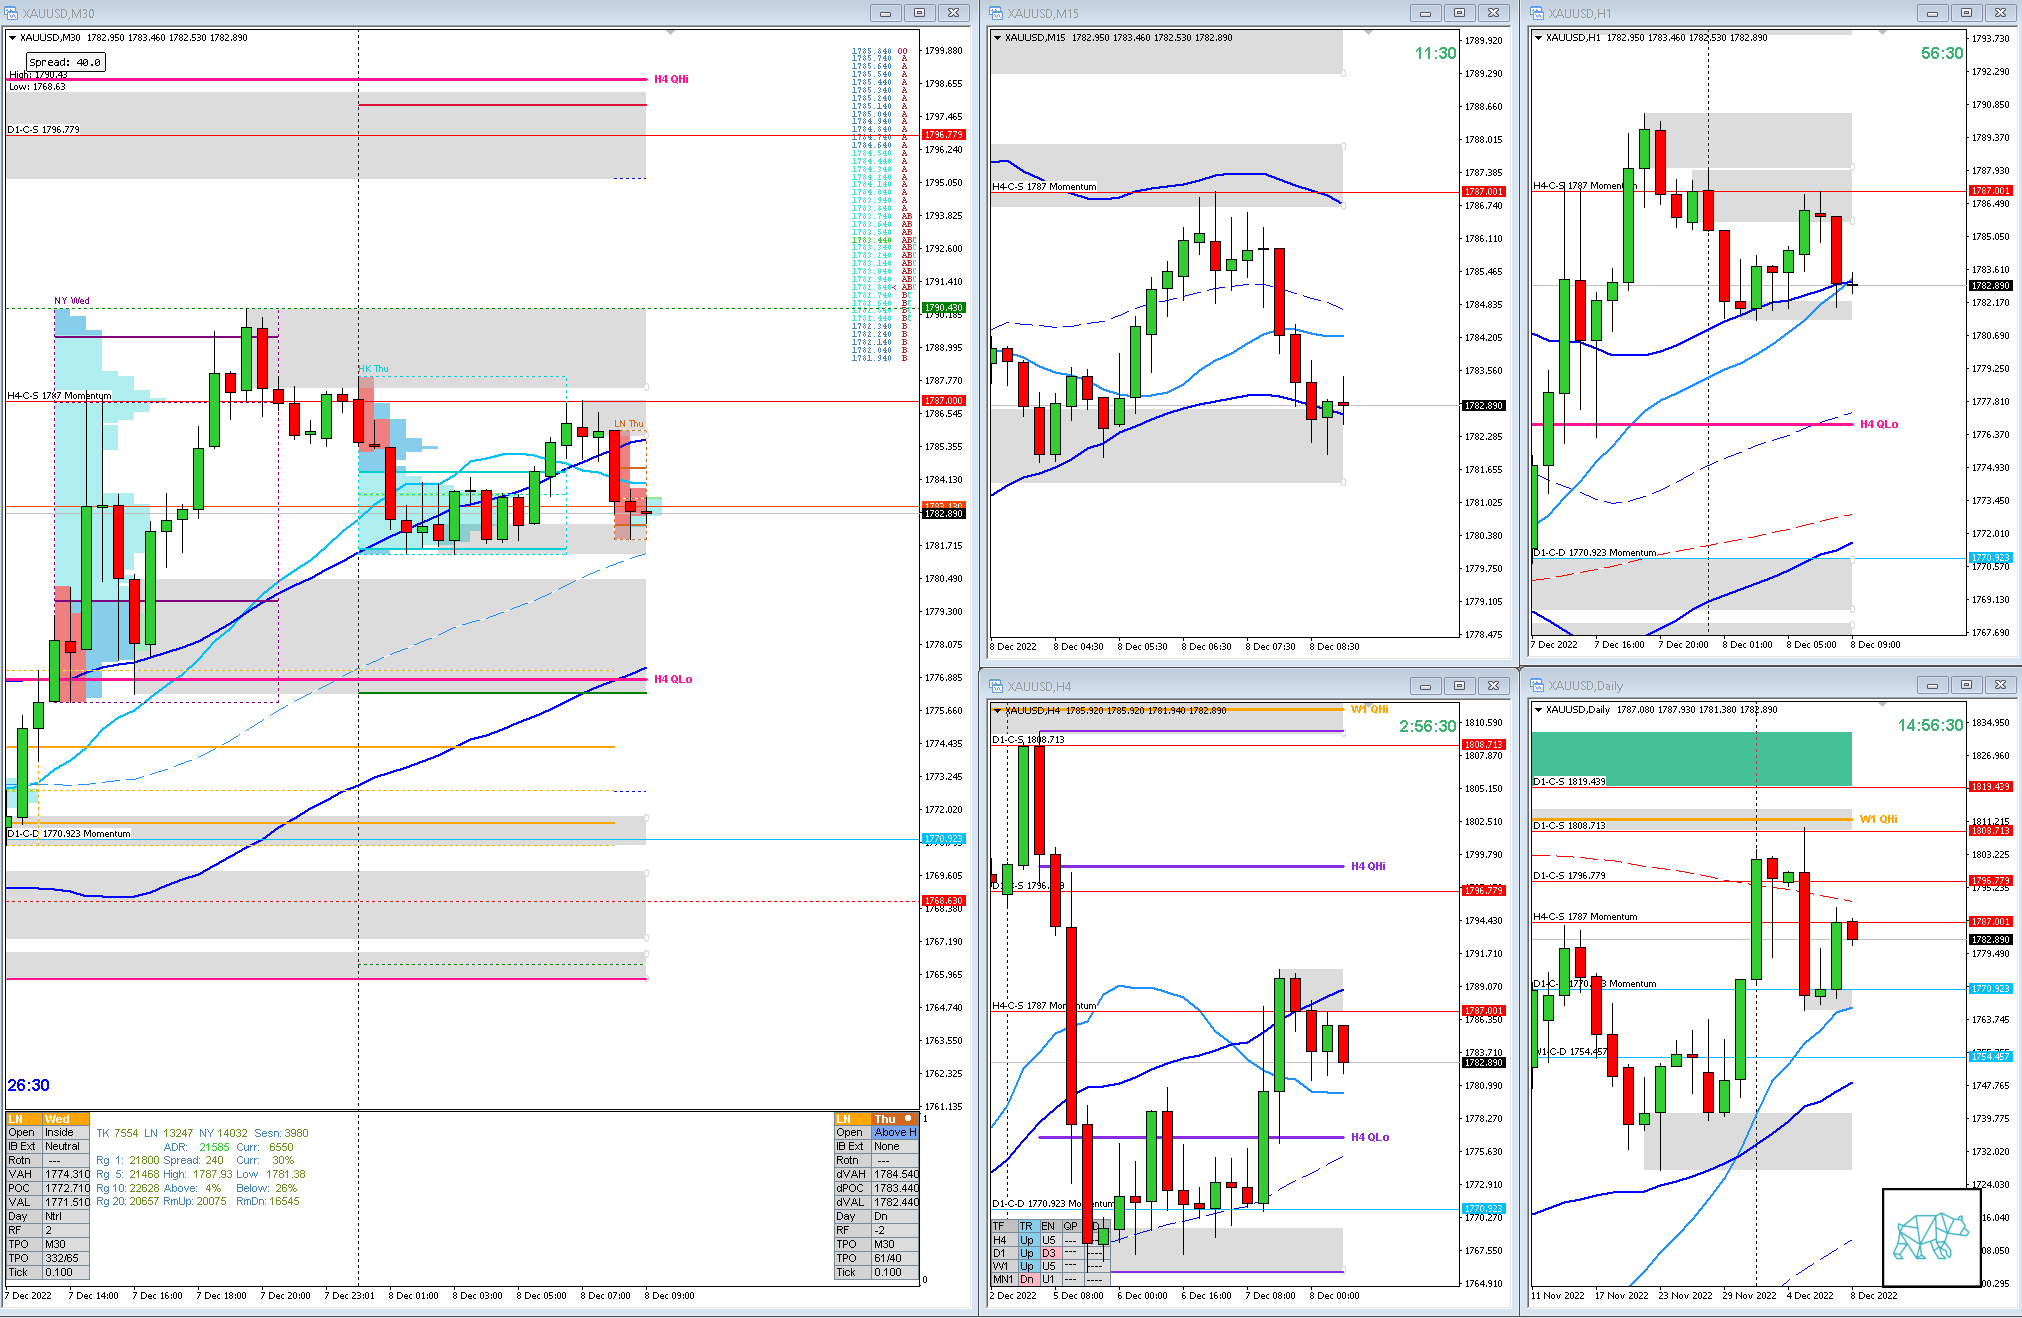
08 Dec 20221208 Premarket Prep Gold
#Fintwit #XAUUSD #GOLD #MarketProfile #Orderflow

This is my premarket prep for today’s European session for GOLD. This prep builds off of my weekly trade plan I made here:
The purpose of a premarket prep is to find setups within my weekly trade plan bias
Larger Timeframe
- MN
- Price trading above body, within range, at MN VWAP
- W1
- Price trading within body, retraced to 50% mark,
- Price trading below W1 QH, W1 50MA in R
Narrative
- D1
- D1 Three Outside Up at D1 VWAP in UT giving D1-C‑D 1770.923 Momentum below VAL
- Price trading below D1 200MA
- H4
- H4 Three Outside Down giving H4-C‑S 1787 Momentum followed by some consolidation
- Trend
- Trend is UP 3/3
- Market Profile
- 2 overlapping values
- LN Open
- Prev. Day Exceeded ADR by 1.01
- 0.87xASR Above Value, Outside Range
- Moderate to Large Imbalance
- Asia traded lower
- 0.30xASR IBR
Additional Notes
- N.A.
Hypos
- Hypo 1
- Short
- Late-Sustained Auction
- Hypo 2
- Long
- Reversal, Possible continuation, Possible Failed Auction
- Hypo 3
- Short
- Failed Auction
- Hypo 4
- Long
- Auction Fade
Clarity / Confidence (1 — 5, low to high)
- 1
Mindful Trading (lack of sleep?)
- Feeling okay
Focus Points for trading development
- Monthly Goals
- Use SL scaling


juan l.
Posted at 15:43h, 08 DecemberMorning!! ( my timezone) / Evening !! (your timezone) . I will be analyzing Spot Gold on a different MT5 demo account so i can follow along with you. Thank you for the Lexicon as it is helping very much in following your analysis.
My thoughts : BOOLISH
since there was a nice base formed in the H4 Qlo and a bullish engulfing i was thinking we would visit the H4Q hi. There
are no road bumps to get in the way. as of this morning. there seems to be a RallyBaseRally forming.
I also noticed most of your moving averages are pointing upwards
BEARAH CASE : The Rally base turns into a Phase 3 distribution and we revisit the H4 Qlo / Demand
Questions:
1. What do you agree / disagree with about my analysis ?
1. How much weight do you put in the angle of your moving averages ?
2. Do you think a verbose expression of your analysis would help me create the narrative for the day ? Is it something you do ? or do you keep it mostly technical ?
3. There was a W‑C-S( 1775) that was touched last month and rejected. Now yesterday was tested and traded through. How does that affect your analysis ?
I hurt you brain, please hurt mine 🙂
T3chAddict
Posted at 05:38h, 09 DecemberThat’s a good idea. Yeah the time I got your message it was already bed time for me 🙂
You’re welcome. Glad to hear it’s helpful.
1. Every TF’s context should be placed within a larger TF context. Hence the top down approach we use to understand the different narratives and how they come together for your particular session. In this case I agree with you although it is not JUST because H4 QLo was rejected and THUS price is going to go to H4 QHi. The D1 narrative showed a momentum move (D1 Three Outside Up) counter the initial supposed rejection W1/D1 QHi (even though on my chart there was no touch and as I mentioned before it was the 1st time touch of D1 200MA and could just be a reaction of that. Which it looks like it was as price is indeed creeping higher).
2. In terms of the MAs I use them as levels where price COULD start reacting. Trend or range. Price COULD start reacting. For example as trend following levels or if price breaks the level after a trend. The angle itself as well as how price is showing (or not showing) strength above/below it ie. is price trading just above/below the MA or is there some distance created between them indicating strength. How long has the trend been going and at what stage of the distribution curve is price developing in relation to the MAs. I include VWAP in this as well as Keltner Channels. Keep in mind that these are supporting factors to what governs and trumps everything else; PRICE ACTION. PA gives us these MAs, SD zone trade locations, etc.
3. So conventional reading of Supply and demands getting taken out means there is strength into that direction ie. more likely for a continuation. However, I find that after an area gets taken out (especially D1 and up, but it also happens on lower timeframes. Don’t take my word for it go and test it) there usually is some kind of short term reversal before there is a continuation. I call this “SD getting popped”. Like a balloon. It gets popped, price reversed short term, then continues. This short term reversal for day traders like us can give a great opportunity to go “countertrend” and is yet another tool in our belt to understand what is going on. Check out my “categories and Tag search” option for some examples (I just noticed I’ve used different tags and categories to identify these setups which I will try and clean up this weekend).
Hence on the D1 I was yet again sceptic if price would sustain the bearish move. That and the 1st touch of D1 200MA. No real touch of QHi. Today being Friday we can see that price had retraced in the developing W1 candle to over 50% mark but now is trading near its high again. Does that mean price will continue higher? NO. But it might 🙂 it’s definitely making a more bullish case then if price would have been stuck at or below the W1 50% mark of last week’s candle.
I hope I hurt your brain. For me?.… BRING ON THE HURT!
juan l.
Posted at 10:05h, 09 Decembermy brain hurts,
T3chAddict
Posted at 11:09h, 09 December🙂